IQR-Based Website Event Anomaly Detection using Looker and Google BigQuery
Website event tracking bugs can become costly quickly. A deployment of a new website version that triggers events multiple times can increase your hosting charges or worse, lead to overage charges from your event collection service vendor that you’d not planned for. A persistent popup can negatively impact your conversion metrics and irritate users. A malfunctioning contact form can result in weeks of lost leads before anyone notices.
Or your website could be working fine but, without you knowing, one of your products goes viral and quickly goes out of stock, something you could have detected if you’d been monitoring your product views/add-to-basket ratio at the time.
But what number of page view events, product view events or product view/add-to-basket events is an “odd” number, an “anomaly”? Using fixed “upper” and “lower” bound limits for those counts and ratios means ignoring the trend of those numbers over time, and while page view and purchase events counts on regular days may be fairly predictable, it certainly wouldn’t be anomalous for those counts to be much, much higher on days such as Black Friday.
We’ve encountered these types of issues working with clients and also managing our own website at https://rittmananalytics.com, and so we put-together an anomaly detection system in Looker that uses BigQuery SQL and the Interquartile Range (IQR) method to detect when website metrics start behaving unusually.
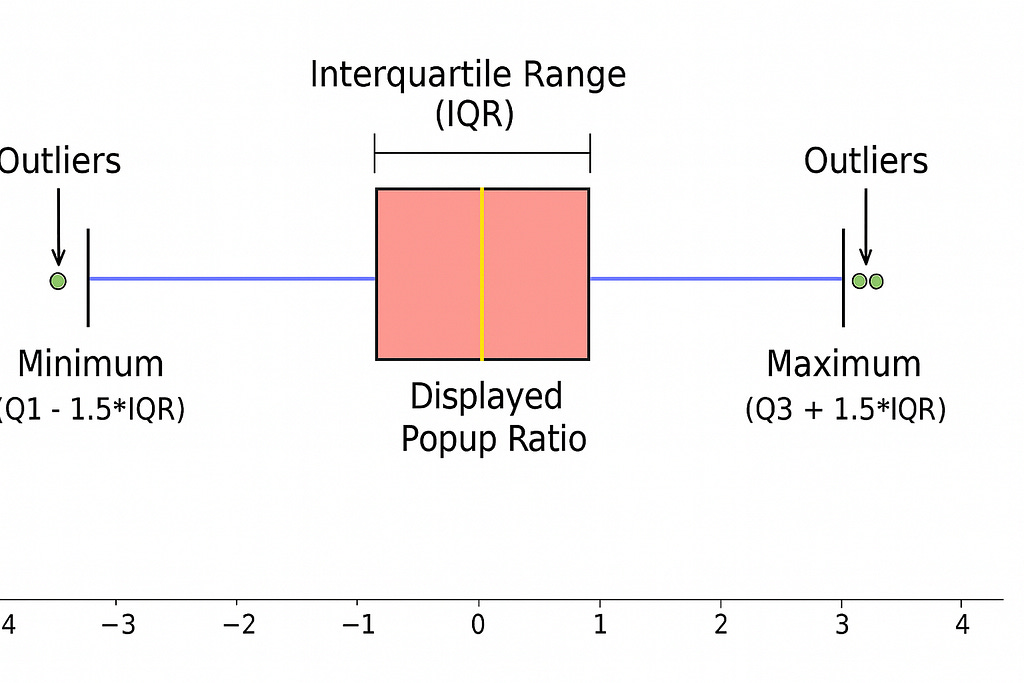
Interquartile Range (IQR) method works well with website event data as it’s robust to outliers and doesn’t assume normal distribution, which is rarely true for web traffic.
The IQR method works by:
Calculating the 25th percentile (Q1) and 75th percentile (Q3) of historical data
Computing the IQR as Q3 — Q1
Defining anomaly thresholds as Q1 — (multiplier × IQR) and Q3 + (multiplier × IQR)
Flagging any values that fall outside these bounds
In our case we’re detecting anomalies for these specific event types and ratios:
Event Types:
Page View
Button Clicked
Contact Us
ICP Modal Displayed
Displayed Popup
Key Ratios:
ICP Modal Displayed / Page View
Displayed Popup / Page View
These metrics and ratios let us know if we’re experiencing an unusually high amount of page views or other types of site behaviour from users, or if we’ve deployed a new marketing or lead-generation tool and its suddenly firing a lot more times than it should do, risking visitors to the site leaving and going elsewhere because of usability problems.
IQR-Based Anomaly-Detection using BigQuery SQL
Our implementation starts with SQL that aggregates daily event counts and calculates rolling statistical baselines.
WITH base_events AS (
  SELECT
      event_type,
      event_ts,
      DATE(event_ts) AS event_date
  FROM `ra-development.analytics.web_events_fact`
  WHERE event_type IN (
      'Page View',
      'Button Clicked',
      'Contact Us',
      'Icp Modal Displayed',
      'Displayed Popup'
    )
),

event_counts AS (
  SELECT
      event_date,
      event_type,
      COUNT(*) AS event_count
  FROM base_events
  GROUP BY event_date, event_type
),

pivoted_counts AS (
  SELECT
      event_date,
      COALESCE(MAX(CASE WHEN event_type = 'Page View' THEN event_count END), 0) AS page_view_count,
      COALESCE(MAX(CASE WHEN event_type = 'Button Clicked' THEN event_count END), 0) AS button_clicked_count,
      COALESCE(MAX(CASE WHEN event_type = 'Contact Us' THEN event_count END), 0) AS contact_us_count,
      COALESCE(MAX(CASE WHEN event_type = 'Icp Modal Displayed' THEN event_count END), 0) AS icp_modal_displayed_count,
      COALESCE(MAX(CASE WHEN event_type = 'Displayed Popup' THEN event_count END), 0) AS displayed_popup_count
  FROM event_counts
  GROUP BY event_date
)
The key insight here is that we’re pivoting our event data from a long format (one row per event type per day) to a wide format (one row per day with columns for each event type). This makes the subsequent ratio calculations much cleaner.
Next, we calculate our key ratios using BigQuery’s SAFE_DIVIDE function to handle division by zero gracefully:
event_ratios AS (
  SELECT
      *,
      CASE WHEN page_view_count != 0 THEN SAFE_DIVIDE(icp_modal_displayed_count, page_view_count) ELSE NULL END AS icp_modal_displayed_ratio,
      CASE WHEN page_view_count != 0 THEN SAFE_DIVIDE(displayed_popup_count, page_view_count) ELSE NULL END AS displayed_popup_ratio
  FROM pivoted_counts
)
BigQuery’s APPROX_QUANTILES function returns an array of quantiles, making it easy to extract Q1 and Q3:
ratio_stats AS (
  SELECT
      r1.event_date,
      APPROX_QUANTILES(r2.icp_modal_displayed_ratio, 4)[OFFSET(1)] AS icp_modal_displayed_ratio_q1,
      APPROX_QUANTILES(r2.icp_modal_displayed_ratio, 4)[OFFSET(3)] AS icp_modal_displayed_ratio_q3,
      APPROX_QUANTILES(r2.displayed_popup_ratio, 4)[OFFSET(1)] AS displayed_popup_ratio_q1,
      APPROX_QUANTILES(r2.displayed_popup_ratio, 4)[OFFSET(3)] AS displayed_popup_ratio_q3
  FROM event_ratios r1
  JOIN event_ratios r2
    ON r2.event_date BETWEEN DATE_SUB(r1.event_date, INTERVAL 371 DAY) AND DATE_SUB(r1.event_date, INTERVAL 1 DAY)
  WHERE r2.icp_modal_displayed_ratio IS NOT NULL OR r2.displayed_popup_ratio IS NOT NULL
  GROUP BY r1.event_date
)
The self-join in the above CTE lets us look-back 371 days (a year plus the maximum variation in days between Black Friday from one year to another) to establish a baseline, excluding the current day. For us we’re detecting anomalies in daily metrics but you could increase the granularity to hourly if a faster response to events is needed.
Dynamic Anomaly Thresholds with LookML Parameters
All of this SQL is going to run as a single LookML derived table definition in a LookML view, like this:
view: anomaly_detection {
  view_label: "Daily Anomaly Detection - Web Events"
    derived_table: {
      sql: WITH base_events AS (
          SELECT
              event_type,
              event_ts,
              DATE(event_ts) AS event_date,
              ...
and as we’re running this SQL within a LookML view, we also now have the ability to introduce parameters into the view and the derived table SQL to enable us to dynamically adjust the thresholds for the upper and lower bounds in our ICQ calculations.
-- ICP Modal Displayed Ratio Anomaly Detection
(rs.icp_modal_displayed_ratio_q1 - {% parameter lower_bound_multiplier %} * (rs.icp_modal_displayed_ratio_q3 - rs.icp_modal_displayed_ratio_q1)) AS icp_modal_displayed_ratio_lower_bound,
(rs.icp_modal_displayed_ratio_q3 + {% parameter upper_bound_multiplier %} * (rs.icp_modal_displayed_ratio_q3 - rs.icp_modal_displayed_ratio_q1)) AS icp_modal_displayed_ratio_upper_bound,

CASE WHEN r.icp_modal_displayed_ratio < (rs.icp_modal_displayed_ratio_q1 - {% parameter lower_bound_multiplier %} * (rs.icp_modal_displayed_ratio_q3 - rs.icp_modal_displayed_ratio_q1))
      OR r.icp_modal_displayed_ratio > (rs.icp_modal_displayed_ratio_q3 + {% parameter upper_bound_multiplier %} * (rs.icp_modal_displayed_ratio_q3 - rs.icp_modal_displayed_ratio_q1))
  THEN TRUE ELSE FALSE END AS is_icp_modal_displayed_ratio_anomalous
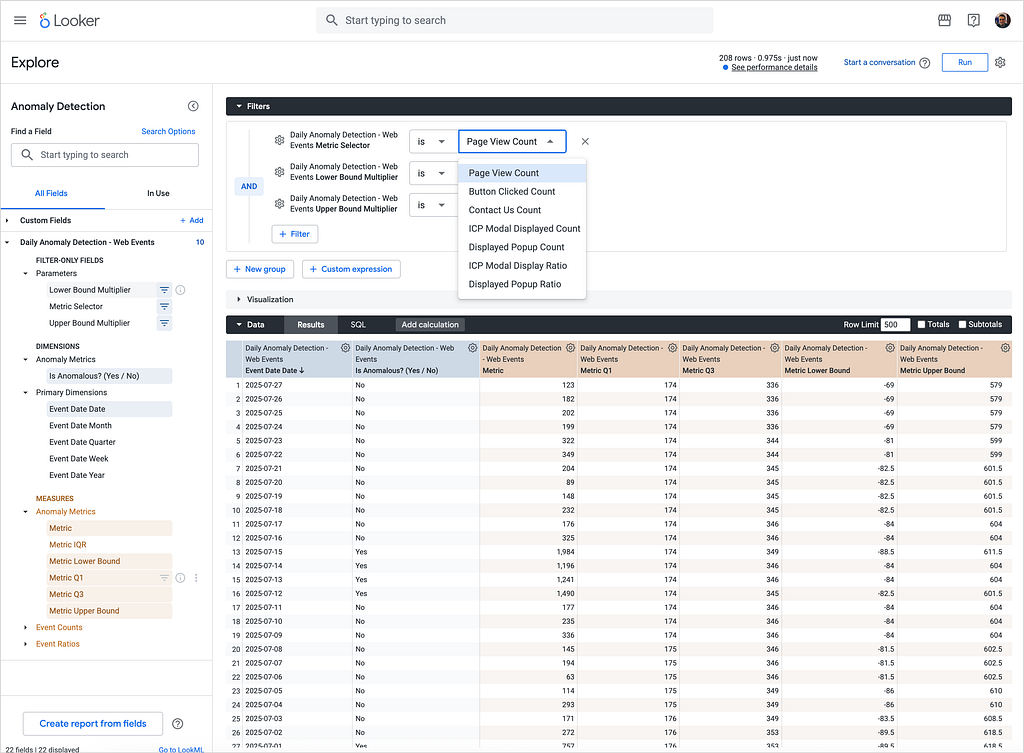
This approach allows users to adjust the sensitivity of anomaly detection in real-time without modifying the underlying SQL, via three parameters we define in the LookML view following the derived table SQL query definition, as shown below:
parameter: anomaly_metric {
  allowed_value: {label: "Page View Count" value: "PAGE_VIEW_COUNT"}
  allowed_value: {label: "Button Clicked Count" value: "BUTTON_CLICKED_COUNT"}
  allowed_value: {label: "Contact Us Count" value: "CONTACT_US_COUNT"}
  allowed_value: {label: "ICP Modal Displayed Count" value: "ICP_MODAL_DISPLAYED_COUNT"}
  allowed_value: {label: "Displayed Popup Count" value: "DISPLAYED_POPUP_COUNT"}
  allowed_value: {label: "ICP Modal Display Ratio" value: "ICP_MODAL_DISPLAYED_RATIO"}
  allowed_value: {label: "Displayed Popup Ratio" value: "DISPLAYED_POPUP_RATIO"}
  default_value: "PAGE_VIEW_COUNT"
  type: unquoted
  label: "Metric Selector"
  group_label: "Parameters"
  description: "Choose which metric (count or ratio) to evaluate for anomalies."
}

parameter: upper_bound_multiplier {
  allowed_value: {label: "1.0" value: "1.0"}
  allowed_value: {label: "1.5" value: "1.5"}
  allowed_value: {label: "2.0" value: "2.0"}
  allowed_value: {label: "2.5" value: "2.5"}
  default_value: "1.5"
  type: unquoted
  label: "Upper Bound Multiplier"
  group_label: "Parameters"
  description: "Multiplier applied to the IQR to calculate the upper threshold for anomaly detection."
}

parameter: lower_bound_multiplier {
  allowed_value: {label: "0.0" value: "0.0"}
  allowed_value: {label: "0.5" value: "0.5"}
  allowed_value: {label: "1.0" value: "1.0"}
  allowed_value: {label: "1.5" value: "1.5"}
  allowed_value: {label: "2.0" value: "2.0"}
  allowed_value: {label: "2.5" value: "2.5"}
  default_value: "1.5"
  type: unquoted
  label: "Lower Bound Multiplier"
  group_label: "Parameters"
  description: "Multiplier applied to the IQR to calculate the lower threshold for anomaly detection."
}
These parameters work together with dynamic measures that adjust based on the selected metric, like so:
measure: metric {
  label_from_parameter: anomaly_metric
  description: "Total value of the selected metric used for anomaly detection."
  group_label: "Anomaly Metrics"
  type: sum
  sql: ${TABLE}.{% parameter anomaly_metric %} ;;
}

dimension: is_metric_anomalous {
  label: "Is Anomalous?"
  description: "Flag indicating if the selected metric falls outside the calculated bounds."
  group_label: "Anomaly Metrics"
  type: yesno
  sql: ${TABLE}.IS_{% parameter anomaly_metric %}_ANOMALOUS ;;
}
The full implementation for the LookML view is available as a Github Gist here.
Analyzing Historical Anomalies as Trends
Now that we’ve setup the LookML view and separately, added it as an explore in your LookML model, you can open-up the Explore interface in Looker and start to analyze the history of anomalies in your event data.
As you can see in the screenshot above, the parameters we defined in the LookML view become filters that let us select:
Metric Selector: Set to “Page View Count” to analyze page view anomalies
Lower Bound Multiplier: Set to 1.5 (this determines how sensitive we are to low outliers)
Upper Bound Multiplier: Set to 1.5 (this determines how sensitive we are to high outliers)
The great thing about this parameterized approach is that you can adjust these values in real-time to fine-tune your anomaly detection sensitivity. A multiplier of 1.5 is moderately sensitive — values of 1.0 will catch more anomalies (potentially including false positives), while values of 2.0+ will only flag the most extreme outliers.
For our analysis, we’re pulling:
Event Date Date (as our dimension)
Metric (which will display as “Page View Count” based on our parameter selection)
Metric Lower Bound and Metric Upper Bound (for visualization)
Is Anomalous? (our boolean flag for anomaly detection)
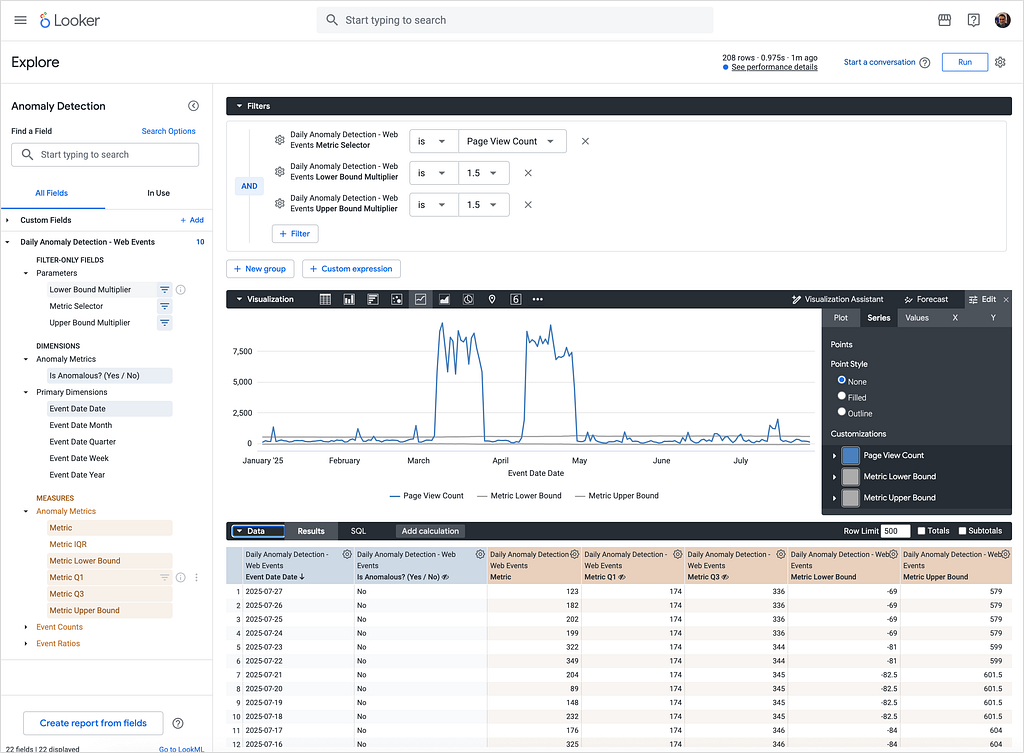
Displaying this anomaly data visually though really makes it clear when your chosen metric is reporting a value way-outside of what’s expected for that day.
The line chart visualization in the screenshot above shows:
Blue line: The actual Page View Count over time
Gray lines: The upper and lower bounds for anomaly detection
Data points: Each point represents a daily aggregate
In this particular example, you can see there was a significant spike in page views around April 14–28, where the actual values exceeded the upper bound threshold.
Baseline period: From March through early April, page views were consistently low and stable
Anomalous spike: The April spike stands out dramatically against the historical baseline
Return to normal: By May, traffic patterns had returned to baseline levels
And if you’re interested in what caused these spikes in page views, all from the same IP address and with browser IDs that changed every 10 or 20 page views thereby leading to our Segment MTU numbers going past our monthly allowance? It was bot traffic scraping every page from our site, every hour, something we only managed to halt by by using Cloudflare’s Web Application Firewall (WAF) feature.
Building a Anomaly-Monitoring Dashboard
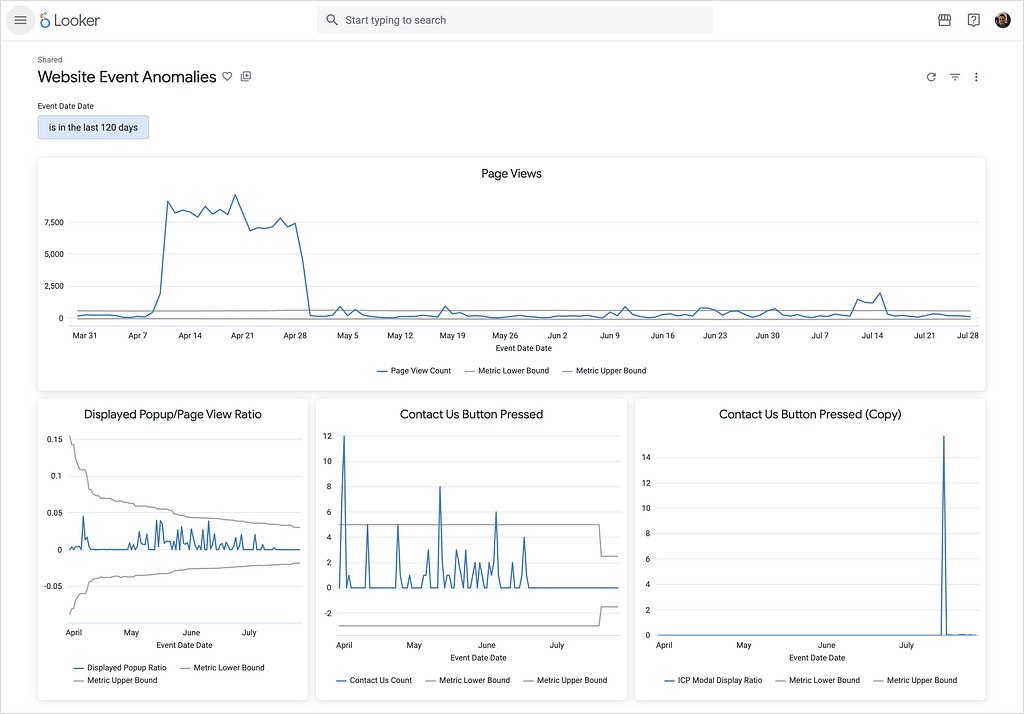
While the Explore feature is excellent for ad-hoc analysis, you can also build a monitoring dashboard that gives you an at-a-glance view of all your critical anomaly-detection metrics. In the screenshot below you can see a simple example of an Anomaly Detection Dashboard in Looker, to which you could also add alerts to tell us, for example, when page views or popup display frequency ratios yesterday were anomalous compared to the norm.
Interested? Find Out More!
Rittman Analytics is a boutique data analytics consultancy that helps ambitious, digital-native businesses scale-up their approach to data, analytics and generative AI.
We’re authorised delivery partners for Google Cloud along with Oracle, Segment, Cube, Dagster, Preset, dbt Labs and Fivetran and are experts at helping you design an analytics solution that’s right for your organisation’s needs, use-cases and budget and working with you and your data team to successfully implement it.
If you’re looking for some help and assistance with your Looker implementation or website event tracking or would just like to talk shop and share ideas and thoughts on what’s going on in your organisation and the wider data analytics world, contact us now to organise a 100%-free, no-obligation call — we’d love to hear from you!
Originally published at https://rittmananalytics.substack.com.
IQR-Based Website Event Anomaly Detection using Looker and Google BigQuery was originally published in Rittman Analytics Blog on Medium, where people are continuing the conversation by highlighting and responding to this story.


